
Process & learnings – a great way to store and share information with a dept or an executive board
Building things with Claude
After completing my Claude certifications, I wanted to put that learning into practice in a useful way. So, I used Claude Cowork to build an artifact, in my case an interactive data visualisation that brings together the key learnings from our A/B testing programme for one of our clients.
(I would like to point out this is a POC and work in progress and I continue working at finding ways to automate more of the processes to reduce the time needed to keep it up to date.)
The end-to-end process was quicker than I expected, and the result gives our team a much easier way to make use of the insights we have gathered over the past year. The repository makes those learnings:
- Easy to access for CRO consultants and stakeholders, because everything is available online.
- Simple to filter, so users can quickly find the information that is most relevant to them.
- Clear and visually engaging, with colour-coded pills, tags and page labels that help users scan the content and spot what matters most.
The artifact is an interactive HTML repository organised by themes linked to our stakeholder’s CRO KPIs. We also mapped it back to the wider business OKRs, so the experimentation work is easier to connect to broader growth goals and business impact.
Currently, the dashboard is updated every month with new test insights, helping us stay data-driven when we iterate on existing tests or design new ones. Because iterations can sometimes be delayed and picked up again months later, the artifact makes it much easier to revisit the recommended next steps alongside any related learnings gathered since.
This work sits within our wider CRO strategy approach, supporting clients in showing how experimentation can create value for the broader business. Having a clear understanding about why the changes worked or not, helps us better grasp visitor behaviour, their needs and expectations.
Over time, we expect this insight repository to help guide product, marketing and wider business teams to make more informed decisions that improve both the product experience as well as user engagement.
It also responds to a challenge I’ve repeatedly heard at industry events: in-house experimentation teams often find it difficult to demonstrate their value to the wider organisation, especially when budget conversations come around.
So, it’s imperative CRO programmes are aligned with broader business objectives and demonstrate that learnings can be applied to the wider needs of strategy and product development.
Ultimately, showing learnings and capitalising on them supports business growth.
This artifact was built with that goal in mind, and with our client’s needs at the centre. Here’s how I built it.
1. Why did I choose this output format?
Each month we meet with our client for a strategy session to review the latest test insights and understand what worked, what didn’t and what we can learn from it. The aim is to keep building on our shared knowledge base, so each new test and hypothesis is shaped by what we already know.
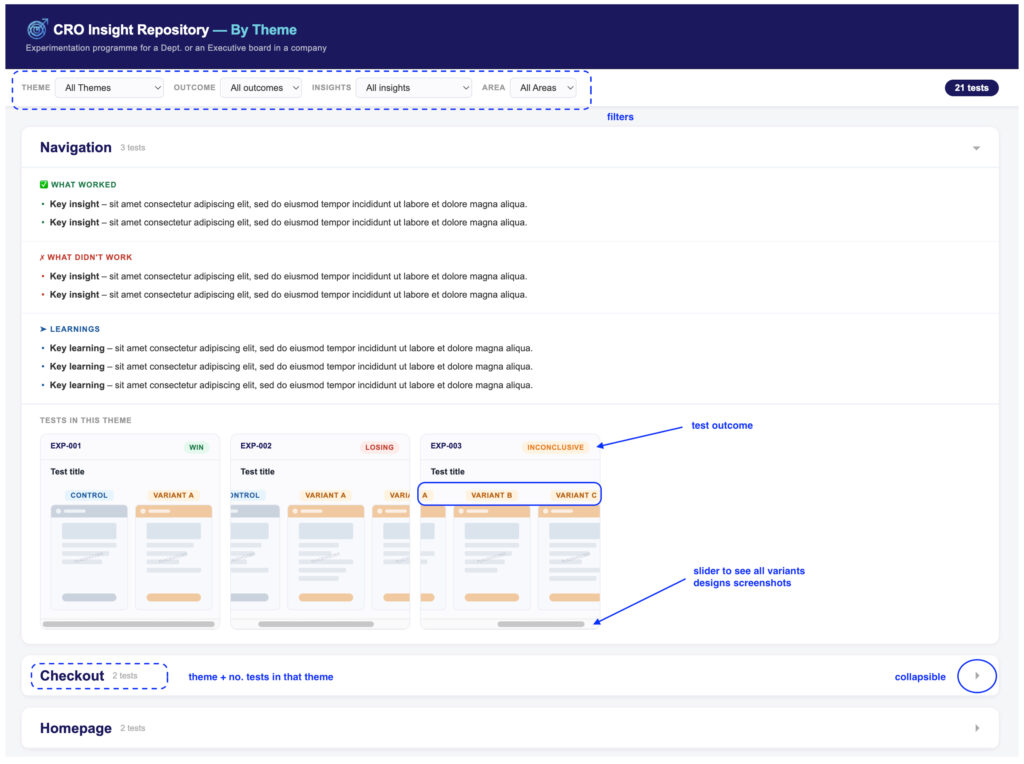
To make the artifact feel familiar and easy to use, I kept the structure close to the monthly deck. It starts with a high-level split by theme, mapped to the relevant KPIs, and then breaks each theme into three simple sections: what worked, what didn’t and the key learnings.
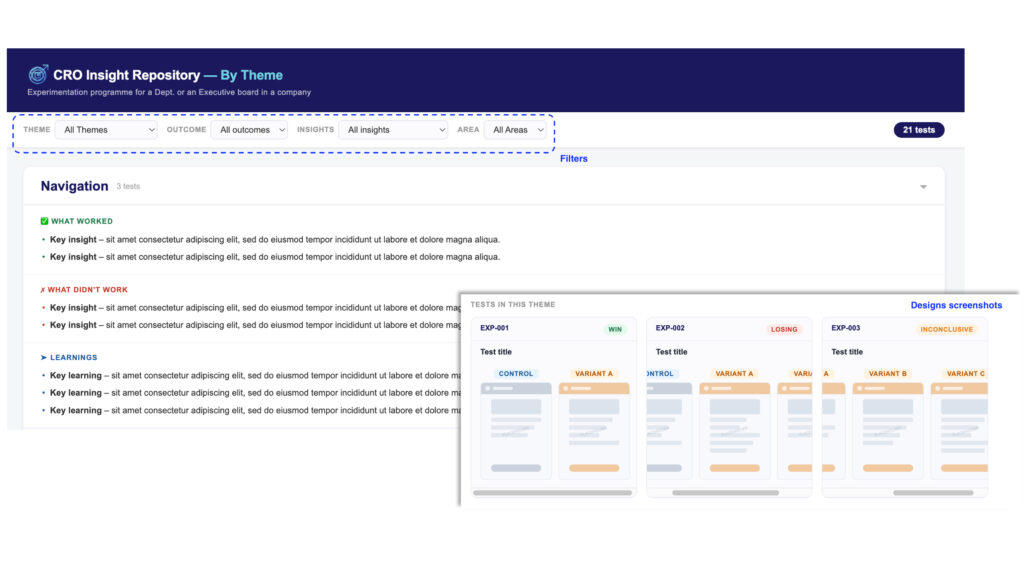
It also needed to be engaging and easy to navigate, so I built the format around a few core features:
- Split by theme, not by test – grouping insights by theme, such as Upgraders, Checkout or SIMO, makes it easier to spot patterns across tests rather than looking at each test in isolation.
- Filters – users can filter by theme, test outcome, insight type and business area, helping them get straight to the information they need.
- Design screenshots – control and variant screenshots sit side by side, making changes easier to see and giving UX designers useful context for future iterations or new designs.
- Collapsible themes – each theme can be opened or closed with a dropdown, which keeps the page cleaner when users are scanning several themes at once.
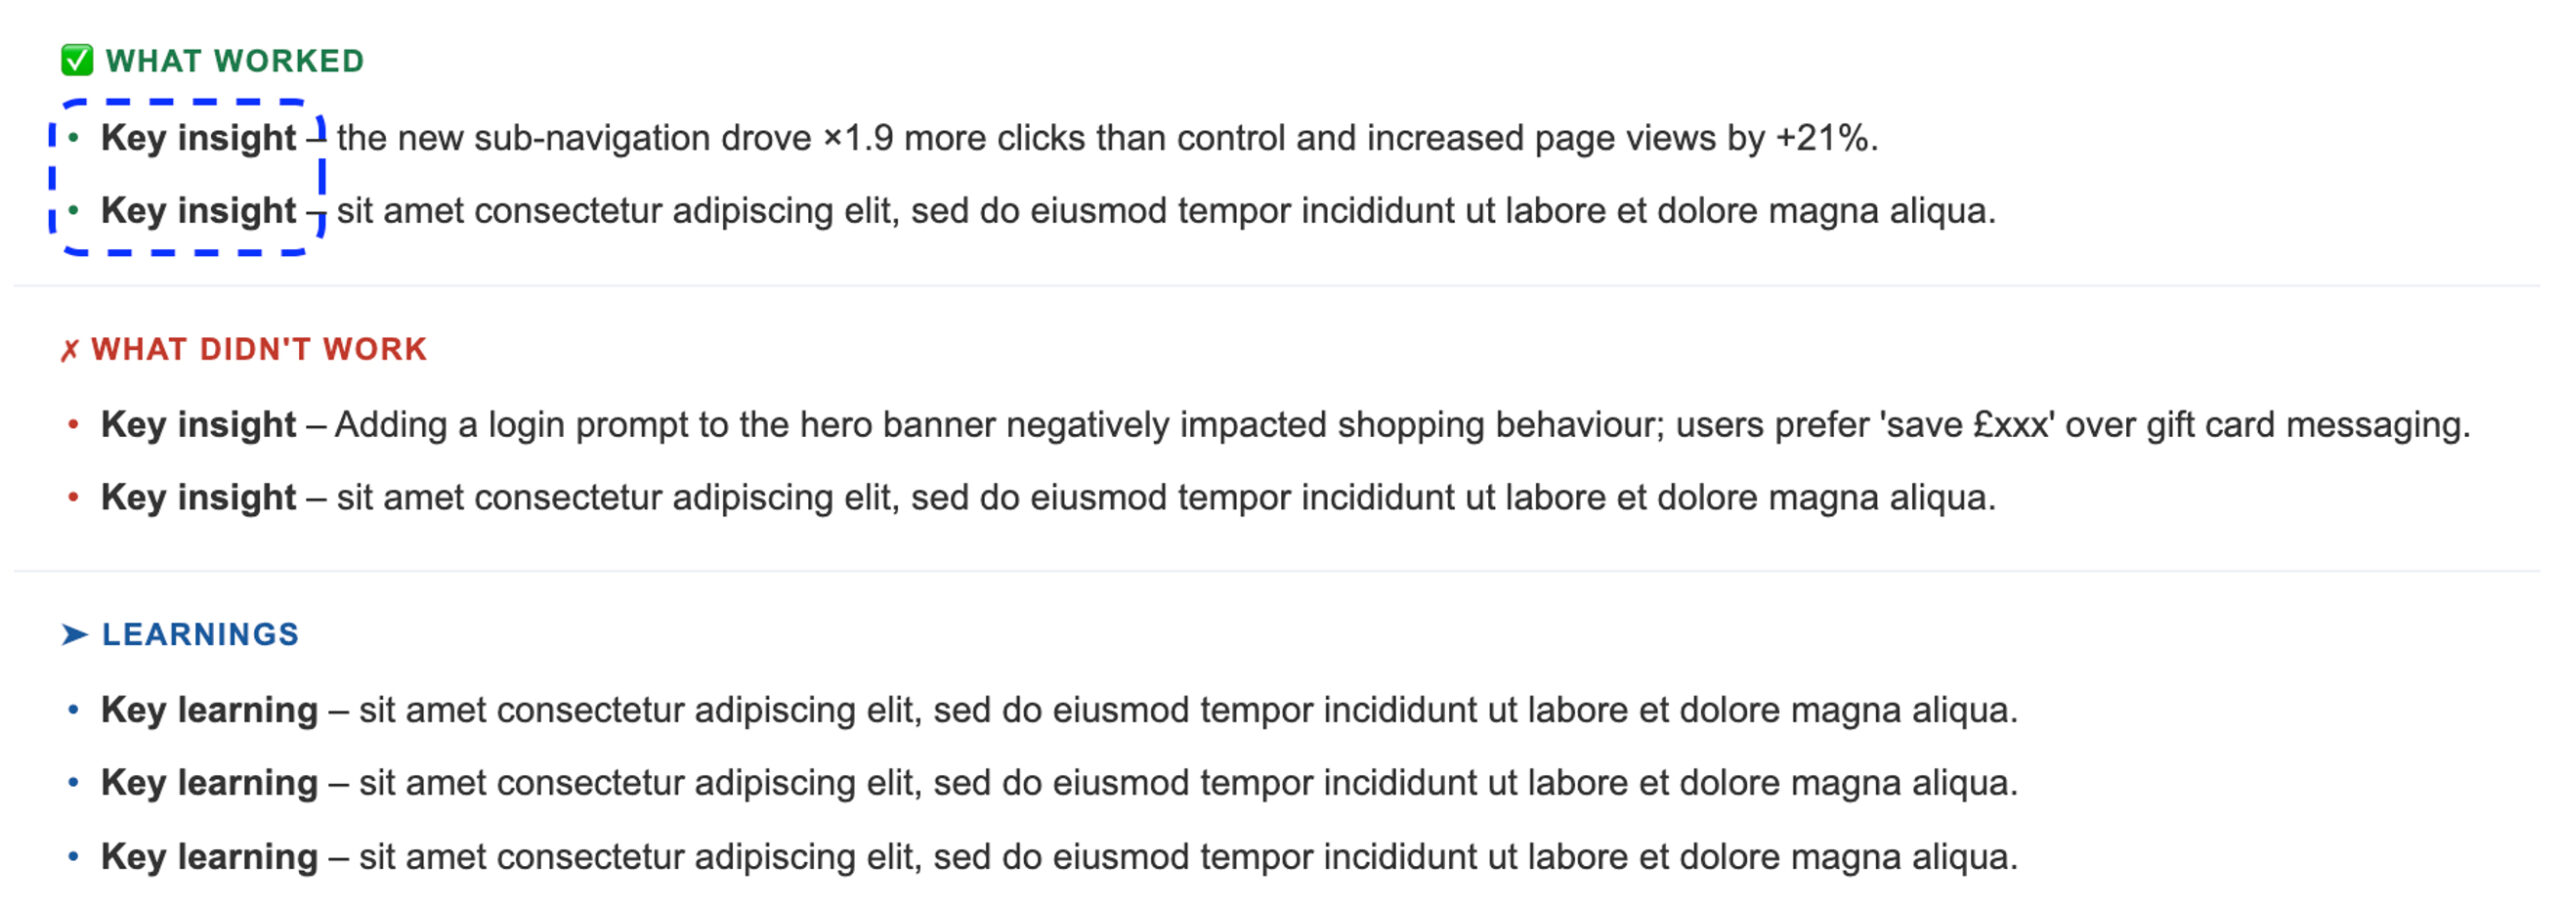
To keep each card easy to read, I also asked Claude to refine the content further:
- Bold topic tags – each bullet starts with a bold label, such as cost transparency, so users can scan the key insight quickly.
- Clean summaries – the insights from the monthly report are condensed further, so the learning is clear and immediate.
2. Sourcing the Data
The data for the artifact came from three main sources.
Test metadata
The first source is a spreadsheet I created to capture the essential details for each test, including the test name, theme and CRO KPI. Because the theme was not already included in the deck, this gave Claude the context it needed to place each insight in the right section. (This is an MVP and currently this was the easiest solution to get started.) The next step to improve the process was to create a field in JIRA capturing this information, so Claude can read straight from the ticket using the MCP.
The insight text and design screenshots
We also create one-pagers for each test, which summarise the results and helps the client understand whether a test was a winner, loser or inconclusive, as well as whether any quick iterations are needed.
Using the 1-pagers, we asked Claude to:
- Curate the output – by condensing the content, merging duplicate insights from previous tests and adding bold topic tags so the repository stays focused and easy to scan.
- Pull the screenshot labels – including Control and all variants and order the images from left to right so the Control always appears first, matching the one-pager structure.
3. Compressing and packaging the data
The raw design screenshots were around 16 MB in total, which was too heavy for an HTML artifact. To reduce the file size, each image was resized and re-encoded as a JPEG, bringing the full set down to around 2.2 MB without any meaningful loss of detail.
To keep the artifact self-contained, every image was then base64-encoded and stored inline in the HTML image store.
4. Building the HTML artifact
The artifact is structured as one collapsible block per theme, with each test card showing insight bullets and design screenshots side by side. I focused on a few features that would make it practical to use:
- Client-side filtering – all filtering runs in JavaScript, so no server is needed.
- Design lightbox – clicking an image opens a full-size modal with Previous and Next controls, making it easier to compare the control against the variants.
- Reliable collapse – the click handler sits only on the theme header, so opening an image does not accidentally collapse the theme.
- Pinned and persistent – the artifact is saved in Cowork so it survives across sessions, and it can be updated with a simple command such as “[Doc name] – add [ticket] to [theme] as [status]”. For now, it can be shared with the client as an HTML file until we can safely host it on a webpage and automate the process more directly.
5. Issues encountered along the way
A few issues came up along the way that are worth flagging for anyone building something similar:
- SVGs breaking python-pptx – this was fixed by reading each PPTX as a ZIP archive and parsing the XML directly.
- Section bleed – parts of the “What worked” text were appearing under “What didn’t”, which was fixed by tracking section state across the paragraphs.
- Cards collapsing the theme – this was achieved by moving the click handler to the header only and adding stopPropagation() to the images.
- Artifact too large – the original file was 16 MB against a 10 MB limit, which was solved through the image compression step above.
- Lightbox stuck on Control – by adding “Previous” and “Next” controls the users was now able to move through every image for the active test.
- Stray short strings – Claude cleaned out orphan headers by filtering out items under 15 characters and known header patterns.
6. How to reuse this pattern
This approach is not a one-off. The same structure can work for any client or stakeholder depending on their set up (eg, you are an agency or in-house) by swapping in that client’s TESTS array, insights JSON, test log and strategy decks.
A few things are worth keeping in mind:
- The image extraction script is reusable across any PPTX, whether the images are PNGs or JPEGs.
- Keep insights in a separate JSON file – editing insights_final.json and regenerating the artifact is much faster than editing the HTML directly.
- Always compress screenshots before embedding – aim to keep the total size under 8 MB so the artifact stays comfortably within the limit.
- Agree an update phrase with the team before pinning the artifact. For example: “Update the CRO insight repository – add [ticket] to [theme] as [status]”.
7. Where I will improve the process
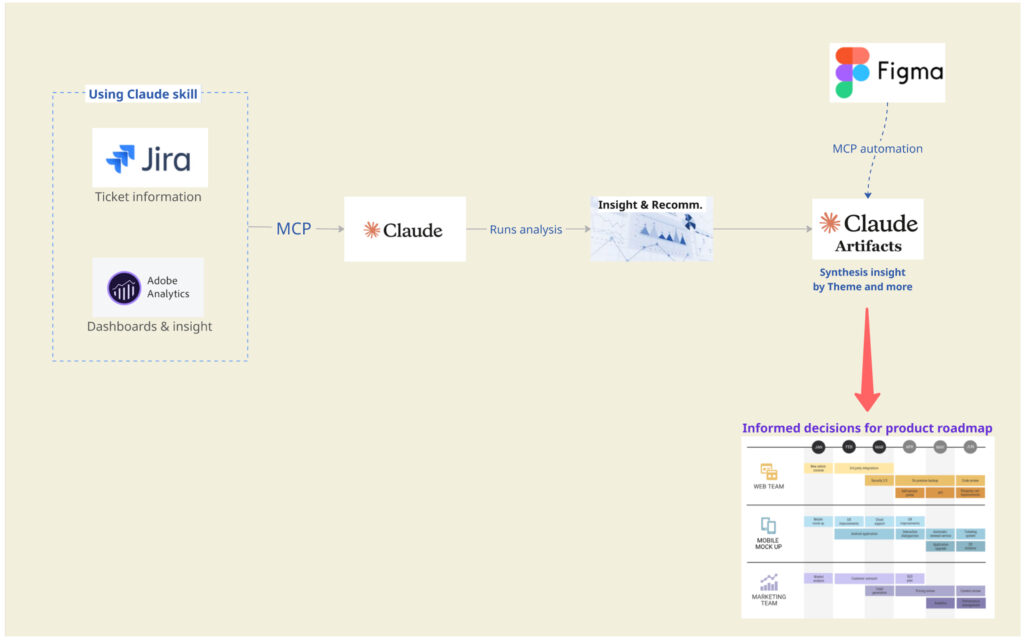
The current process does not yet make full use of the Figma MCP or AA MCP, mainly because of some setup challenges with the Claude connectors.
Access permissions were more limitative than expected as well, and Claude was sometimes inconsistent when navigating Figma files and distinguishing between the control and variant designs.
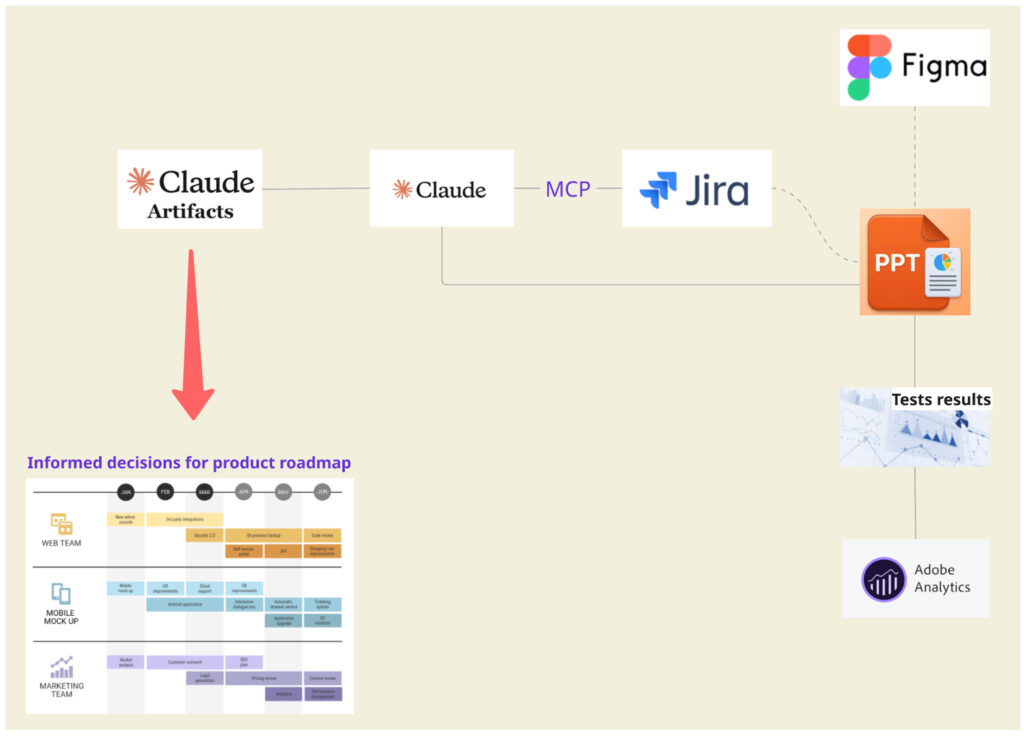
The aim is to automate as much as possible for Claude to be able to use the connectors to:
- Grab the design directly from the Figma file in the JIRA ticket whereas currently it’s reading it from the 1-pager analysis.
- Accessing AA and JIRA allows it to build dashboards for the relevant test metric then run the analysis and draw conclusion turning it into insight (tests results).
- Tests results are then processed and added to the artifact to update the insight repository and continue to shape the product roadmap.
- Use the analytical skill I’ve built for test results analysis.
To conclude
The biggest takeaway from building this CRO insight repository is that AI – in this instance Claude – becomes most valuable when it is embedded into a process to solve a real team challenge.
What started as a practical way to organise A/B testing learnings has become a more strategic foundation for connecting experimentation to customer behaviour, product decisions and wider business goals.
It is still a work in progress, but even this first version has already made our team’s learnings easier to access, share and build on. Enhancing my day-to-day work is precisely where AI is already driving value.

